The 90-Day Segment Gate: How to Test a New Market Before You Commit Territory and Budget
Most companies enter a new segment with a market-sizing deck and no defined exit point. This post walks through a 90-day gate model, with the specific metrics to track and the stop or go thresholds to set before you spend a dollar.

Most teams enter a new segment with a slide deck, not a stop or go date. Someone sizes the total addressable market, picks a vertical or geography that looks promising, assigns a rep or two, and marketing builds campaign assets. Nobody writes down what happens if it does not work, because writing that down feels like betting against your own plan.
Six months in, there is no data argument left, only a sunk cost argument. The rep assigned to the segment has made it personal. Marketing has budget already committed to the next quarter of campaigns. Everyone can feel that it is not working, but nobody set the bar that would make it official, so the segment limps along for another two quarters before someone finally kills it, usually during a budget review that has nothing to do with the original hypothesis.
Why the Slide Deck Approach Fails
The market-sizing deck answers the wrong question. It tells you how big the opportunity could theoretically be. It does not tell you whether your team can reach that opportunity, convert it at an acceptable rate, or close it within a timeline your cash flow can tolerate.
This gap shows up everywhere in how SMBs run their sales motion generally, not just in new segment testing. According to the Mass Tech Leadership Council, 82% of leaders do not forecast future sales, and 66% lack a documented sales process. If you cannot forecast your existing business with discipline, you have no foundation for predicting how a brand new, unproven segment will behave. Teams skip straight from market size to headcount and spend decisions without ever building the bridge of evidence in between.
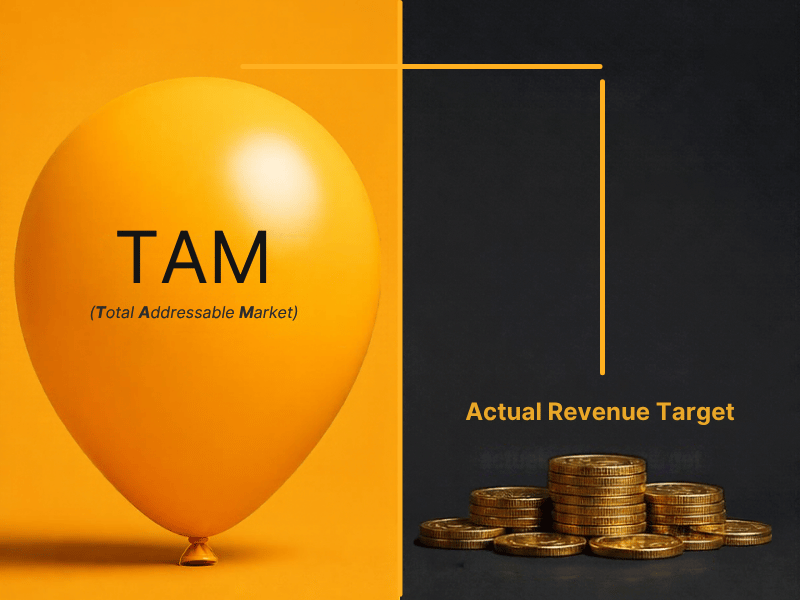
The other failure mode is treating every account in the target segment as equally reachable. A total addressable market number is not a sales forecast. It is a ceiling. The real test is how many of those accounts you can actually get in front of, how many convert to qualified conversations, and what happens after that. Skipping this step is why companies mistake a large theoretical market for real pipeline, according to RevOps Consulting.io, and it is the single most common reason a new segment investment goes sideways.
Step One: Write the Segment Hypothesis Before You Spend Anything
Before assigning a rep or building a campaign, write a one-page hypothesis. This is not a market-sizing exercise. It is a specific, falsifiable claim with numbers attached.
Include five fields: the ICP definition for this segment, the estimated count of reachable accounts (not total market, reachable with your current list-building and outbound capacity), the expected response rate based on comparable outbound efforts you have already run, the expected qualified opportunity rate from those responses, and the expected average contract value and sales cycle length based on your closest existing analog.
If you do not have a comparable outbound effort to base response rate on, say so explicitly and use a conservative placeholder, then flag it as an assumption to validate in the first 30 days. The point of writing this down is not precision. It is giving yourself something concrete to compare actual results against in 90 days, instead of a vague sense of whether things feel like they are working.
Step Two: Size the 90-Day Test, Not the Segment
Once the hypothesis is written, size a test that fits inside 90 days with the capacity you actually have. This means picking a fixed number of accounts, usually a few hundred for an SMB outbound motion, not the full addressable list.
Assign one rep, or a fraction of one rep's time, not a full team. Set a campaign budget that is a test budget, not a full-quarter marketing spend commitment. The goal of this phase is to generate enough signal to evaluate the hypothesis, not to maximize volume.
Define what a meeting looks like, what qualifies as a real opportunity, and what the minimum viable win rate is to justify expansion. These definitions matter more than people expect. If your stage-advancement criteria are vague, you will talk yourself into believing the segment is working even when it is not. This is not a hypothetical risk. According to the Mass Tech Leadership Council, 88% of SMB leaders lack clear requirements for advancing a deal stage. A segment test built on top of fuzzy stage criteria will produce a number that looks good and means nothing.
Step Three: Build the Stop or Go Scorecard
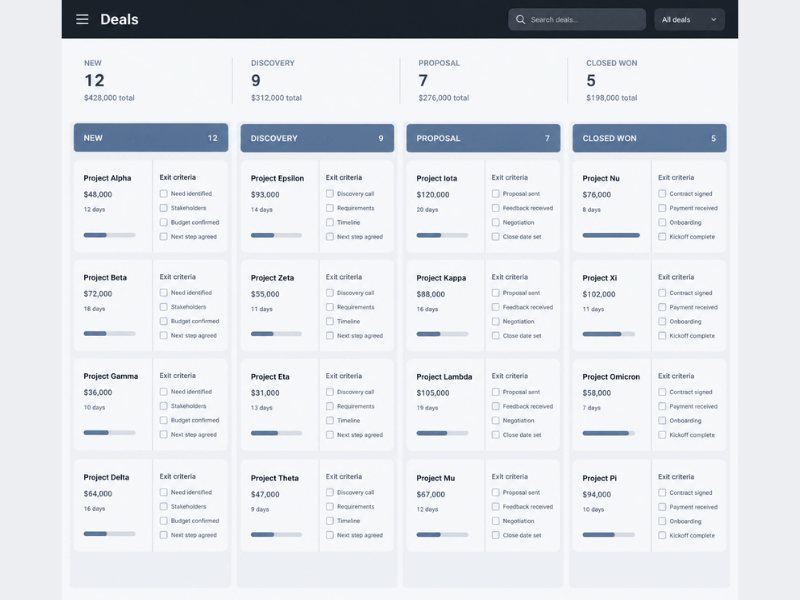
This is the piece most teams skip entirely, and it is the one that actually prevents the sunk cost trap. Before day one of the test, write down the specific numbers that constitute a go decision and the specific numbers that constitute a stop decision. Put both on the same page, reviewed on the same date.
Track four things weekly: accounts contacted against the planned total, response rate against your hypothesis number, qualified opportunities generated, and early signal on deal velocity, meaning how many of the opportunities are moving through stages versus sitting still. Sales cycle benchmarks vary widely by industry, so use your own closest analog rather than an outside number, but if nothing is moving through stages by week six of a ninety-day test, that is itself a data point worth flagging early rather than waiting for the full window to close.
Also build a slippage column into this scorecard. Broader benchmarks on deal slippage, cited by SalesScreen, show roughly 60% of forecasted deals slip or never close, and practitioner data cited by SalesGrowth.com shows win rates falling from 18% after a one-week slip to single digits after longer delays. A new segment test is especially vulnerable to this because you do not yet have a baseline for what normal slippage looks like in that market. If early opportunities start slipping, record the cause, whether it is budget, access to the real decision maker, procurement friction, or internal delay on your side. A pattern of slippage concentrated in one cause is a signal about the segment itself, not just bad luck on a few deals.
Set the actual review date on the calendar before the test starts, and treat it the way you would treat a board meeting. Nobody reschedules it because the numbers are inconvenient.
What to Do With the Verdict
At the 90-day mark, compare actuals against the hypothesis, not against how people feel about the segment. If response rate, opportunity count, and early win signal are at or above the threshold you set, that is your go decision, and it earns incremental territory and budget, not a full commitment all at once. If the numbers are meaningfully below threshold, that is a stop decision, and the honest version of that conversation is cheaper than another two quarters of quiet underperformance.
The hardest part of this discipline is not the math. It is the willingness to set the bar before you know the answer, so the decision belongs to the data instead of to whoever argues loudest in the review meeting.
If your team is heading into a new segment, vertical, or geography without this kind of test built in, or if your existing forecast process has the same gaps this framework is designed to prevent, that is exactly the kind of setup work I do. Reach out to LangLine Consulting if you want a second set of eyes on the test before you commit the budget.